A quick introduction to basic debugging tools for linux systems

Table of Contents
The scope of this article is to cover the best common-use debugging tools available on Linux systems.
Firstly: let me qualify “basic”. I’m using this term because the breadth of debugging tools on Linux is so large. “basic” does not mean that these tools are super simple to understand deeply or if you aren’t already an expert in them that you are somehow “noob”; that’s not the case at all.
Secondly: there is no inventing being done here. I’m just surfacing information in this article which you can already find in the man pages. I would strongly recommend you check the relevant man page for the tool you find of interest in this article.
Thirdly: for the curious, these tools generally get their information from existing counters and statistics in /proc/ and /sys/. In the man pages for these tools you can see a FILES section which details the data source for the given tool.
“crisis tools”⌗
This section is taken from Brendan Gregg’s book ‘System Performance’ (4.1.2). It covers not only where you can install some of the binaries mentioned in this article but also other useful tools for debugging. All credit to him for this list.
| package | provides |
|---|---|
| procps | ps(1), vmstat(8), uptime(1), top(1) |
| util-linux | dmesg(1), lsblk(1), lscpu(1) |
| sysstat | iostat(1), mpstat(1), pidstat(1), sar(1) |
| iproute2 | ip(8), ss(8), nstat(8), tc(8) |
| numactl | numastat(8) |
| linux-tools-common linux-tools-$(uname -r) | perf(1), turbostat(8) |
| bcc-tools (aka bpfcc-tools) | opensnoop(8), execsnoop(8), runqlat(8), runqlen(8), softirqs(8), hardirqs(8), ext4slower(8), ext4dist(8), biotop(8), biosnoop(8), biolatency(8), tcptop(8), tcplife(8), trace(8), argdist(8), funccount(8), stackcount(8), profile(8) and more … |
| bpftrace | bpftrace, basic versions of opensnoop(8), iolatency(8), iosnoop(8), bitesize(8), funccount(8), kprobe(8) |
| perf-tools-unstable | Ftrace versions of opensnoop(8), execsnoop(8), iolatency(8), iosnoop(8), bitesize(8), funccount(8), kprobe(8) |
| trace-cmd | trace-cmd(1) |
| nicstat | nicstat(1) |
| ethtool | ethtool(8) |
| tiptop | tiptop(1) |
| msr-tools | rdmsr(8), wrmsr(8) |
| github.com/brendangregg/msr-cloud-tools | showboost(8), cpuhot(8), cputemp(8) |
| github.com/brendangregg/pmc-cloud-tools | pmcarch(8), cpucache(8), lcache(8), tlbstat(8), resstalls(8) |
top⌗
When: A reasonable first place to look for an issue.
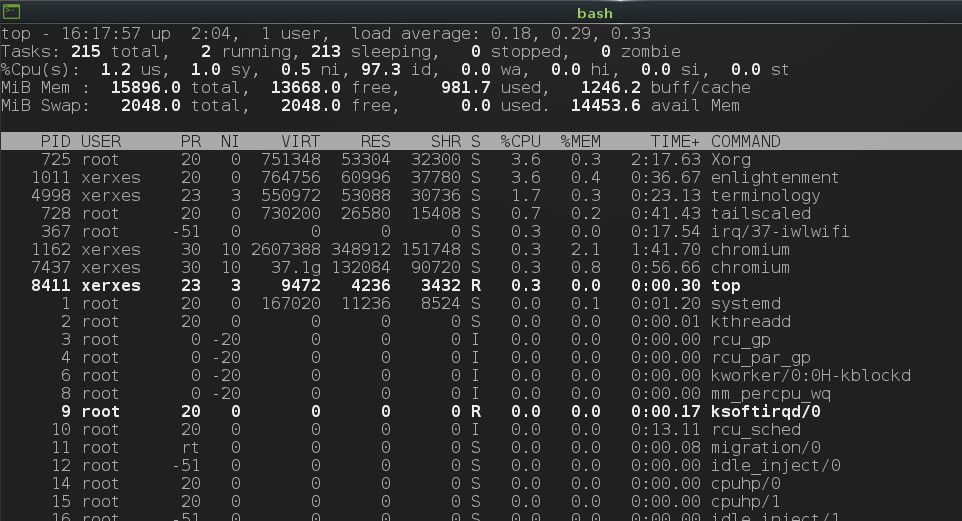
This is a command-line utility in Linux that allows users to view the processes running on their system and monitor their resource usage in real-time. It can be used to identify performance bottlenecks, track the usage of system resources, and troubleshoot issues on a Linux system.
The output of top will include a list of processes running on the system, along with the following information for each process:
- The process ID (PID)
- The user owning the process
- The CPU and memory usage of the process
- The command that started the process
From the output you can identify some performance issues with your system. For example, if a single process is consuming a large amount of CPU or memory resources, it could be causing performance issues for your system. Similarly, if multiple processes are consuming high amounts of resources, it could indicate that your system is struggling to keep up with demand and may be a bottleneck.
One common problem that top can help identify is resource contention which occurs when multiple processes or applications are competing for the same system resources.
I suspect this tool is familiar to many of you already:

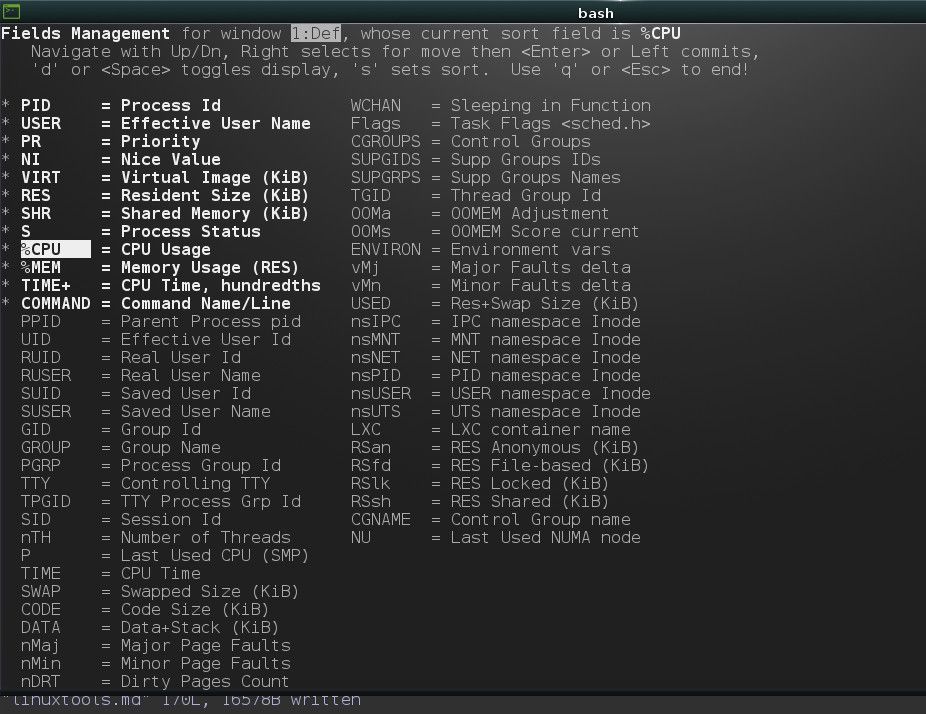
However what you may not realise is that you can pull much more data from it. Press ‘f’ when in top to access the fields management view and select other columns to display:

htop is a visually prettier alternative to top and that can make understanding the system at a glance easier.
mpstat⌗
When: you think there’s an issue with the CPU utilization.
mpstat is a command-line tool that is used to monitor the performance of a Linux system by displaying the CPU usage of each processor and the overall system.
Imagine that you are the system administrator of a web server that is experiencing slow performance and perhaps even downtime. You check the web server logs but nothing obvious is standing out so you begin to suspect there’s something else wrong with the system. One general check we can do is on the CPU cores - this is where mpstat comes in.
mpstat -P ALL
This will display the CPU usage statistics for all CPU cores on the system. The output will look something like this:
Linux 4.9.0-8-amd64 (server.petermcconnell.com)  01/01/2023  _x86_64_    (2 CPU)

02:34:56 AM  CPU    %usr   %nice    %sys %iowait    %irq   %soft  %steal  %guest  %gnice   %idle
02:34:56 AM  all    20.00    0.00    5.00    0.00    0.00    0.00    0.00    0.00    0.00   75.00
02:34:56 AM    0    22.50    0.00    6.25    0.00    0.00    0.00    0.00    0.00    0.00   71.25
02:34:56 AM    1     7.50    0.00    3.75    0.00    0.00    0.00    0.00    0.00    0.00   88.75
The first line shows the Linux version, hostname, and CPU architecture. The second line displays the column headers, which show the various metrics that are being measured. The third line, labeled “all,” shows the overall CPU usage for all CPU cores combined. The fourth and fifth lines show the CPU usage for each individual CPU core.
In this example, we can see that CPU 0 is running at a higher utilization than CPU 1. This could indicate that there is an issue with CPU 0 that is causing it to work harder than it should. To further investigate the issue we can opt to print these statistics every second by adding a “1” to the end of the command:
mpstat -P ALL 1
This will print statistics from each core every second, showing the current CPU usage. By watching the output over time, we can see if there are any patterns or spikes in the usage of a particular CPU core.
If we notice that one of the CPU cores is consistently running at a higher utilization than the others, we can try to identify the cause of the problem. One way to do this is by using the top command to see which processes are using the most CPU resources. It could be that the program itself is misconfigured and not properly distributing load over the available cores.
iostat⌗
When: you think there’s an issue with IO.
The iostat tool is a command-line utility in Linux that allows users to monitor input/output (I/O) statistics for devices, partitions, and network filesystems. It can be used to identify performance bottlenecks and track the usage of system resources by I/O operations.
To use iostat, you need to specify the interval at which you want to collect data, as well as the devices or partitions you want to monitor. For example, the following command will display I/O statistics for all devices every 2 seconds, 5 times:
$ iostat -p ALL 2 5
Linux 5.4.0-72-generic (myputer) 	30/12/22 	_x86_64_	(4 CPU)

avg-cpu:  %user   %nice %system %iowait  %steal   %idle
           1.40   15.48    4.48    0.99    0.00   77.66

Device             tps    kB_read/s    kB_wrtn/s    kB_dscd/s    kB_read    kB_wrtn    kB_dscd
loop0             0.00         0.00         0.00         0.00          0          0          0
loop1             0.00         0.00         0.00         0.00          0          0          0
loop2             0.00         0.00         0.00         0.00          0          0          0
loop3             0.00         0.00         0.00         0.00          0          0          0
loop4             0.00         0.00         0.00         0.00          0          0          0
loop5             0.00         0.00         0.00         0.00          0          0          0
loop6             0.00         0.00         0.00         0.00          0          0          0
loop7             0.00         0.00         0.00         0.00          0          0          0
sda               4.83        79.27       106.76         0.00     858983    1156820          0

... repeat
You can also get more simple summaries - for example, CPU utilization report:
$ iostat -c
Linux 5.4.0-72-generic (urputer) 	30/12/22 	_x86_64_	(4 CPU)

avg-cpu:  %user   %nice %system %iowait  %steal   %idle
           1.36   15.09    4.37    0.95    0.00   78.22
Or a device utilization report:
iostat -d -h -p ALL
Linux 5.4.0-72-generic (xerxes) 	30/12/22 	_x86_64_	(4 CPU)

      tps    kB_read/s    kB_wrtn/s    kB_dscd/s    kB_read    kB_wrtn    kB_dscd Device
     0.00         0.0k         0.0k         0.0k       0.0k       0.0k       0.0k loop0
     0.00         0.0k         0.0k         0.0k       0.0k       0.0k       0.0k loop1
     0.00         0.0k         0.0k         0.0k       0.0k       0.0k       0.0k loop2
     0.00         0.0k         0.0k         0.0k       0.0k       0.0k       0.0k loop3
     0.00         0.0k         0.0k         0.0k       0.0k       0.0k       0.0k loop4
     0.00         0.0k         0.0k         0.0k       0.0k       0.0k       0.0k loop5
     0.00         0.0k         0.0k         0.0k       0.0k       0.0k       0.0k loop6
     0.00         0.0k         0.0k         0.0k       0.0k       0.0k       0.0k loop7
     4.82        73.5k       103.6k         0.0k     841.2M       1.2G       0.0k sda
     0.01         0.3k         0.0k         0.0k       3.1M       0.5k       0.0k sda1
     0.00         0.0k         0.0k         0.0k       2.0k       0.0k       0.0k sda2
     4.71        73.1k       103.6k         0.0k     836.0M       1.2G       0.0k sda5
We’re seeing a lot of devices here which are showing to be inactive. We can easily hide those from view - rarely when debugging an issue do you want to see statistics for a device that isn’t being used. To hide these, pass -z:
iostat -d -h -p ALL -z
Linux 5.4.0-72-generic (xerxes) 	30/12/22 	_x86_64_	(4 CPU)

      tps    kB_read/s    kB_wrtn/s    kB_dscd/s    kB_read    kB_wrtn    kB_dscd Device
     4.84        72.1k       103.1k         0.0k     841.2M       1.2G       0.0k sda
     0.01         0.3k         0.0k         0.0k       3.1M       0.5k       0.0k sda1
     0.00         0.0k         0.0k         0.0k       2.0k       0.0k       0.0k sda2
     4.73        71.7k       103.1k         0.0k     836.0M       1.2G       0.0k sda5
By analyzing this data, you can identify performance issues with your devices or partitions. For example, if the number of read or write operations is consistently high, it could indicate that the device or partition is heavily used and may be a bottleneck. Similarly, if the average time taken for each I/O operation is consistently high, it could indicate that the device or partition is struggling to keep up with demand.
A common problem that iostat can help identify is disk saturation, which occurs when a disk is being used to its maximum capacity and can’t keep up with the demand for I/O operations. This can lead to slow performance and potential data loss. In iostat output this problem may manifest as a consistently high percentage of time the device is busy with I/O operations and a high average time taken for each I/O operation.
sar⌗
When: general purpose. you think there’s an issue with CPU, Memory, Network or Block devices. Can record findings to files on disk for comparisson later (which is the main selling point of sar over, say vmstat)
The sar (System Activity Report) tool is a command-line utility in Linux that allows users to monitor various system performance metrics over time. It can be used to identify performance bottlenecks, track the usage of system resources, and troubleshoot issues on a Linux system.
To use sar, you need to specify the interval at which you want to collect data and the system performance metrics you want to monitor. For example, the following command will display CPU utilization statistics every 2 seconds:
sar 2
The output of sar will include various performance metrics, depending on the options you specify. Some of the metrics that sar can monitor include:
- CPU utilization
- Memory usage
- Disk I/O activity
- Network activity
- Load average (a measure of the system’s CPU and I/O utilization)
By analyzing this data, you can identify any performance issues with your system. For example, if the CPU utilization is consistently high, it could indicate that your system is struggling to keep up with demand and may be a bottleneck. Similarly, if the memory usage is consistently high, it could indicate that your system is running out of available memory.
sar stores its reports in /var/log/sysstat/ by default and will look for files in this directory when you ask it for some reports. The file it looks for changes depending on the INTERVAL value passed to it. This can result in an error if a report isn’t available from yesterday:
# -B tells sar to create a report on paging statistics
sar -B
Cannot open /var/log/sysstat/sa30: No such file or directory
Please check if data collecting is enabled
You can specify 0 as the interval time which tells sar to use statistics for the time since the system was started:
sar 0 -B
Linux 5.4.0-72-generic (herputer) 	30/12/22 	_x86_64_	(4 CPU)

17:51:10     pgpgin/s pgpgout/s   fault/s  majflt/s  pgfree/s pgscank/s pgscand/s pgsteal/s    %vmeff
17:51:10        66.01     99.20   3074.99      0.38   1853.06      0.00      0.00      0.00      0.00
sar can also be used to report on I/O and transfer rate statistics:
sar 0 -b
Linux 5.4.0-72-generic (hisputer) 	30/12/22 	_x86_64_	(4 CPU)

17:53:49          tps      rtps      wtps      dtps   bread/s   bwrtn/s   bdscd/s
17:53:49         4.64      1.32      3.32      0.00    130.43    196.40      0.00
… and block devices:
sar 0 -d
Linux 5.4.0-72-generic (ourputer) 	30/12/22 	_x86_64_	(4 CPU)

17:55:12          DEV       tps     rkB/s     wkB/s     dkB/s   areq-sz    aqu-sz     await     %util
17:55:12       dev8-0      4.63     64.81     97.66      0.00     35.13      0.05     11.69      2.11
… and more. sar is a very powerful tool - please check out the man page for more info.
vmstat⌗
When: you think there’s an issue with memory usage or I/O activity.
The vmstat (Virtual Memory Statistics) tool is a command-line utility in Linux that allows users to monitor various system performance metrics, including memory usage and I/O activity. It can be used to identify performance bottlenecks, track the usage of system resources, and troubleshoot issues on a Linux system.
To use vmstat you need to specify the interval at which you want to collect data. For example, the following command will display system performance statistics every 2 seconds:
vmstat 2
The output of vmstat will include the following information:
- The number of processes in various states (e.g. running, waiting, blocked)
- The amount of memory being used, including the amount of available memory
- The number of page faults (when a process requests a page of memory that is not in physical memory and must be retrieved from disk)
- The amount of I/O activity, including the number of read and write operations per second
free⌗
When: you want to assess the state of memory on a machine.
free -w -h
              total        used        free      shared     buffers       cache   available
Mem:           15Gi       1.1Gi        12Gi       224Mi        95Mi       1.4Gi        13Gi
Swap:         2.0Gi          0B       2.0Gi
Here we see:
- The total amount of available and used memory
- The amount of used and available swap space (virtual memory on disk used to store data when the system’s physical memory is full)
- The number of used and available buffers (a type of cache used to store data temporarily) and cache (data stored in memory to speed up access to frequently used data)
lsblk⌗
When: you assume there’s an issue with the block devices and want to first check everything is in place.
The lsblk (List Block Devices) command is a command-line utility in Linux that allows users to view a list of block devices (e.g. hard drives, SSDs, USB drives) attached to their system. It can be used to view the available block devices, their mount points, and their partition layouts. You may want to use this tool to validate if block devices are available and mounted.
To use lsblk, you simply need to enter the command followed by any desired options. The following command will display a list of all block devices on the system:
$ lsblk -f
NAME   FSTYPE LABEL UUID                                 FSAVAIL FSUSE% MOUNTPOINT
sda
├─sda1 vfat         29C1-1F85                               511M     0% /boot/efi
├─sda2
└─sda5 ext4         e3a6ec94-05ab-4e15-a310-e5797a2c55e9    419G     3% /
The output of lsblk will include the following information for each block device:
- The device name (e.g. sda, sdb)
- The device type (e.g. disk, partition)
- The size of the device
- The mount point (if the device is mounted)
- The filesystem type (if the device is formatted with a filesystem)
df⌗
When: you’re aware of disk space issues and want to check the current availability.
The df (Disk Free) command is a command-line utility in Linux that allows users to view the amount of available and used disk space on their system. It can be used to identify if a disk is approaching or at capacity.
To use df, you simply need to enter the command followed by any desired options. The following command will display the total amount of available and used disk space on the system:
df -h /
Filesystem      Size  Used Avail Use% Mounted on
/dev/sda5       457G   15G  420G   4% /
The output of df will include the following information for each file system:
- The file system name (e.g. /dev/sda1)
- The total size of the file system
- The amount of used and available space on the file system
- The percentage of used space on the file system
- The mount point (the location where the file system is mounted in the directory structure)
perf⌗
When: you are aware of a processing issue and want to understand which process it’s coming from, or you want to drill into the process to understand why it’s not performing to the expected standard.
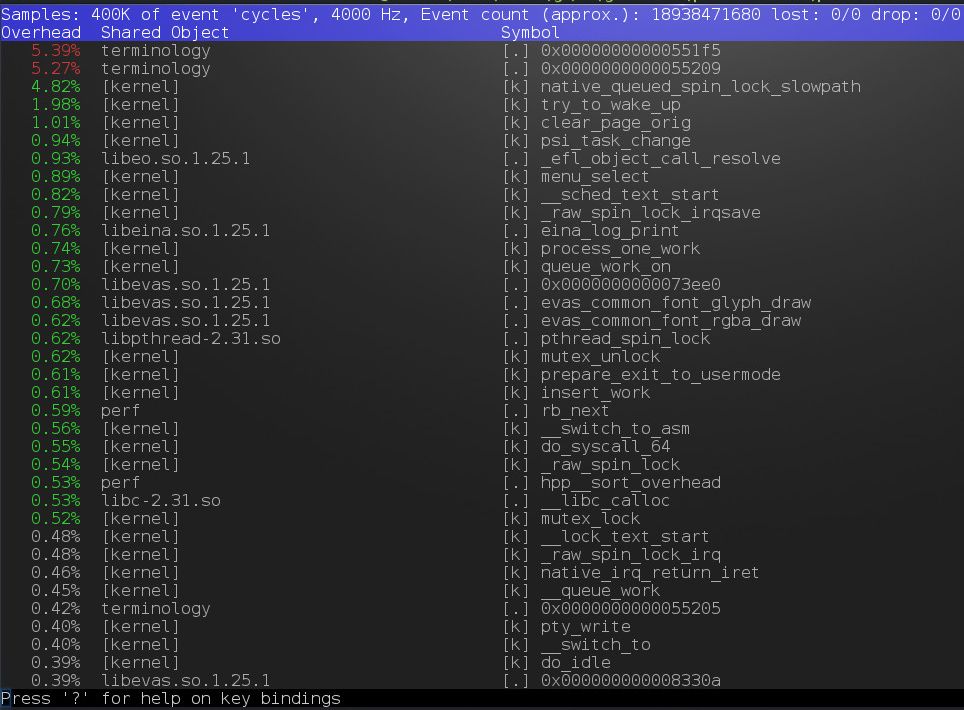
This tool allows users to monitor various performance metrics and events on their system. It can be used to identify performance bottlenecks, track the usage of system resources, and troubleshoot issues on a Linux system. Unlike the other tools in this article perf allows us to actually peek into the running program to see which parts of it are consuming cpu cycles. This is an incredibly valuable tool to have for those wanting to performance engineer on Linux and I have a practical example of this detailed in https://www.petermcconnell.com/posts/perf_eng_with_py12/.
To use perf, you need to specify the type of performance data you want to collect, as well as the specific events or metrics you want to monitor. To get general cpu profiling you can run:
perf top -a

Perf also allows you to gather performance statistics. For example, the following command will collect CPU performance data for the cpu-clock event:
perf stat -e cpu-clock
^C
 Performance counter stats for 'system wide':

         11,633.97 msec cpu-clock                 #    3.998 CPUs utilized

       2.909972618 seconds time elapsed
The scope of what you can do with perf is huge - too large for this article, but I couldn’t leave it off the list. Perhaps a perf deep dive article will come here soon …
uptime⌗
When: you want to get a quick understanding of system load over the past 1, 5, 15 minutes or want to see how long the machine has been up for.
uptime
19:26:35 up  5:12,  1 user,  load average: 0.33, 0.37, 0.37
further reading⌗
The Linux Programming Interface book is a fantastic book to learn the Linux fundamentals. In particular it breaks down virtual memory into understandable chunks and also introduces some of the debugging tools mentioned in this article:

Systems Performance by Brendan Gregg is full of amazing material that also covers the tools in this article but goes into much greater depth and covers the likes of bpf which wasn’t touched upon in this article:

I’d also recommend checking out Branden Gregg’s website - lots of solid content in there: https://www.brendangregg.com/
In particular the USE method article should be of interest (https://www.brendangregg.com/usemethod.html)
