Perf engineering with Python 3.12
Table of Contents
overview⌗
3.12 brings perf profiling! In this article we take a look at how the new perf
profiling support helps reduce our dummy Python script from 36 seconds to 0.8
seconds. We’ll introduce the Linux tool perf and also FlameGraph.pl, look
at some disassembly and go bug hunting. You can view the code for this article
here: https://github.com/peter-mcconnell/petermcconnell.com/tree/main/assets/dummy/perf_py_proj
Take a second to go check out https://docs.python.org/3.12/howto/perf_profiling.html and indeed the changelog at https://www.python.org/downloads/release/python-3120a3/. The important part (for this post) from these links is:
The Linux perf profiler is a very powerful tool that allows you to profile and obtain information about the performance of your application. perf also has a very vibrant ecosystem of tools that aid with the analysis of the data that it produces.
The main problem with using the perf profiler with Python applications is that perf only allows to get information about native symbols, this is, the names of the functions and procedures written in C. This means that the names and file names of the Python functions in your code will not appear in the output of the perf.
Since Python 3.12, the interpreter can run in a special mode that allows Python functions to appear in the output of the perf profiler. When this mode is enabled, the interpreter will interpose a small piece of code compiled on the fly before the execution of every Python function and it will teach perf the relationship between this piece of code and the associated Python function using perf map files.
writing a “bad” program⌗
I’m excited to try this, so lets get going. Firstly lets create a python script for us to profile. I’m doing this before installing Python 3.12 as I want to create a FlameGraph of how this process looks in 3.10 verses 3.12. Here we have a script that attempts to perform lookups against a large list:
import time


def run_dummy(numbers):
    for findme in range(100000):
        if findme in numbers:
            print("found", findme)
        else:
            print("missed", findme)


if __name__ == "__main__":
    # create a large sized input to show off inefficiency
    numbers = [i for i in range(20000000)]

    start_time = time.time()  # get the current time [start]
    run_dummy(numbers)  # run our inefficient method
    end_time = time.time()  # get the current time [end]

    duration = end_time - start_time  # Calculate the duration
    print(f"Duration: {duration} seconds")  # Print the duration
Running this I get the following result:
python3.10 assets/dummy/perf_py_proj/before.py
...
found 99992
found 99993
found 99994
found 99995
found 99996
found 99997
found 99998
found 99999
Duration: 36.06884431838989 seconds
36 seconds is bad enough for us to pick up a reasonable amount of samples.
flamegraphs!⌗
Now we can create our FlameGraph:
# record profile to "perf.data" file (default output)
perf record -F 99 -g -- python3.10 assets/dummy/perf_py_proj/before.py
# read perf.data (created above) and display trace output
perf script > out.perf
# fold stack samples into single lines
# here I reference ~/FlameGraph/ - you can get this from https://github.com/brendangregg/FlameGraph
~/FlameGraph/stackcollapse-perf.pl out.perf > out.folded
# generate flamegraph
~/FlameGraph/flamegraph.pl out.folded > ./assets/perf_example_python3.10.svg
This gives us a nice SVG that visualises the traces:
This isn’t useful … I can see most of the time was spent in “new_keys_object.lto_priv.0” but that is meaningless in the context of the code.
time for Python 3.12…⌗
First I need to install it - the steps for this vary depending on OS - follow the build instructions here for your environment: https://github.com/python/cpython/tree/v3.12.0a3#build-instructions
# for me on ubuntu:22.04
# ensure I have python3-dbg installed
sudo apt-get install python3-dbg

# build python
export CFLAGS="-fno-omit-frame-pointer -mno-omit-leaf-frame-pointer"
./configure --enable-optimizations
make
make test
sudo make install
unset CFLAGS

# after this I reset my systems python3 symlink to 3.10 as 3.12 isn't yet stable
# for testing python3.12 I'll call "python3.12" instead of "python3"
ln -sf /usr/local/bin/python3.10 /usr/local/bin/python3
With that installed I first need to enable perf support. This is detailed in https://docs.python.org/3.12/howto/perf_profiling.html and there are three options: 1) an environment variable, 2) an -X option or 3) dynamically using sys. I’ll go for the environment variable approach as I don’t mind everything being profiled for a small script:
export PYTHONPERFSUPPORT=1
Now we simply repeat the process above using the python3.12 binary instead:
# record profile to "perf.data" file (default output)
perf record -F 99 -g -- python3.12 assets/dummy/perf_py_proj/before.py
# read perf.data (created above) and display trace output
perf script > out.perf
# fold stack samples into single lines
# here I reference ~/FlameGraph/ - you can get this from https://github.com/brendangregg/FlameGraph
~/FlameGraph/stackcollapse-perf.pl out.perf > out.folded
# generate flamegraph
~/FlameGraph/flamegraph.pl out.folded > ./assets/perf_example_python3.12.before.svg
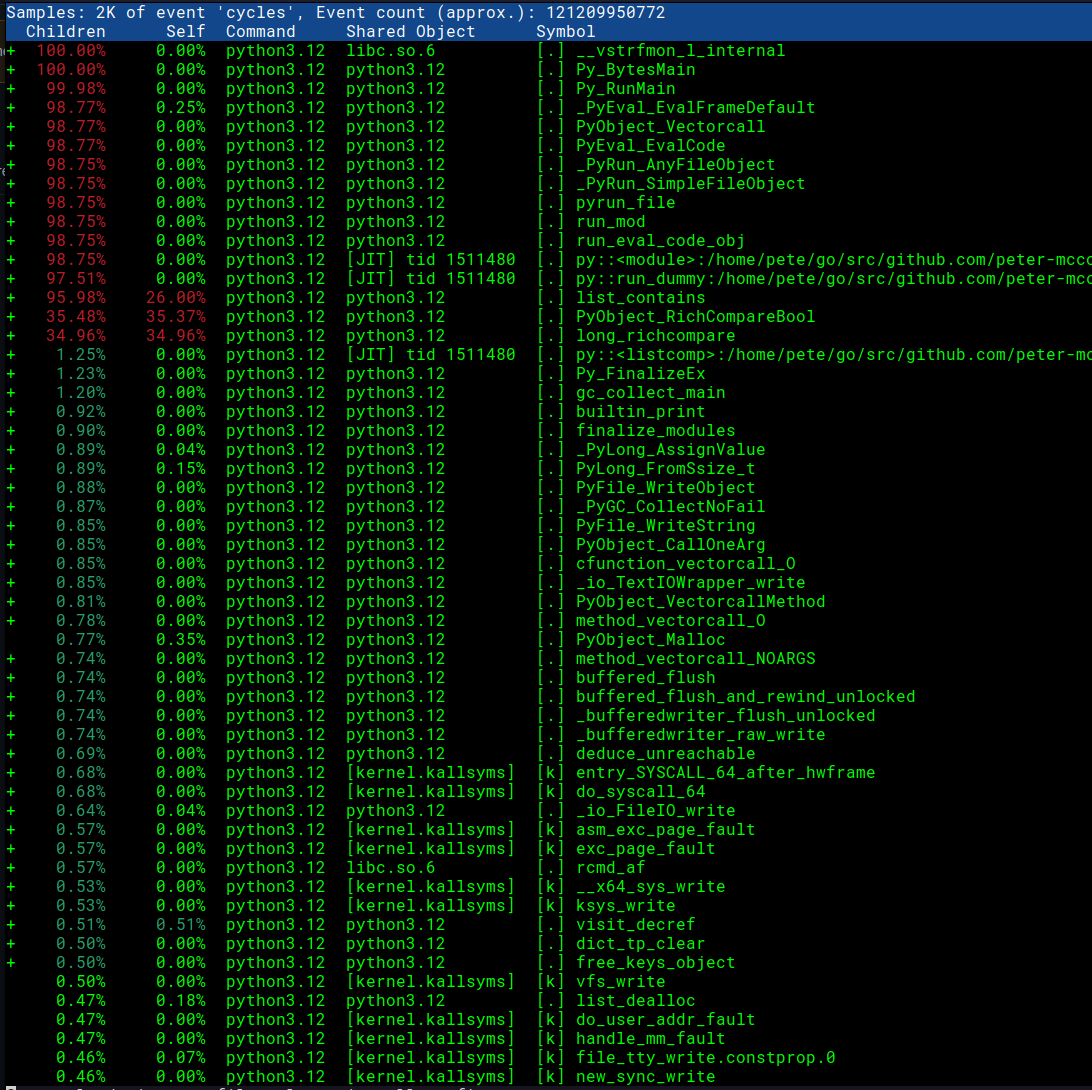
First we’ll take a peek at the report with perf report -g -i perf.data

Awesome! We can see our Python function names and script names!
Now we can take a look at the updated SVG that visualises the traces with Python 3.12:
This is already looking much more useful. We see the majority of the time is being spent doing comparisons and in the list_contains method. We can also see the specific file before.py and method run_dummy that is calling it.
investigation time / the fix⌗
Now that we know where in our code the problem is, we can take a look at the source code in CPython to see why the list_contains method would be so slow: https://github.com/python/cpython/blob/199507b81a302ea19f93593965b1e5088195a6c5/Objects/listobject.c#L440
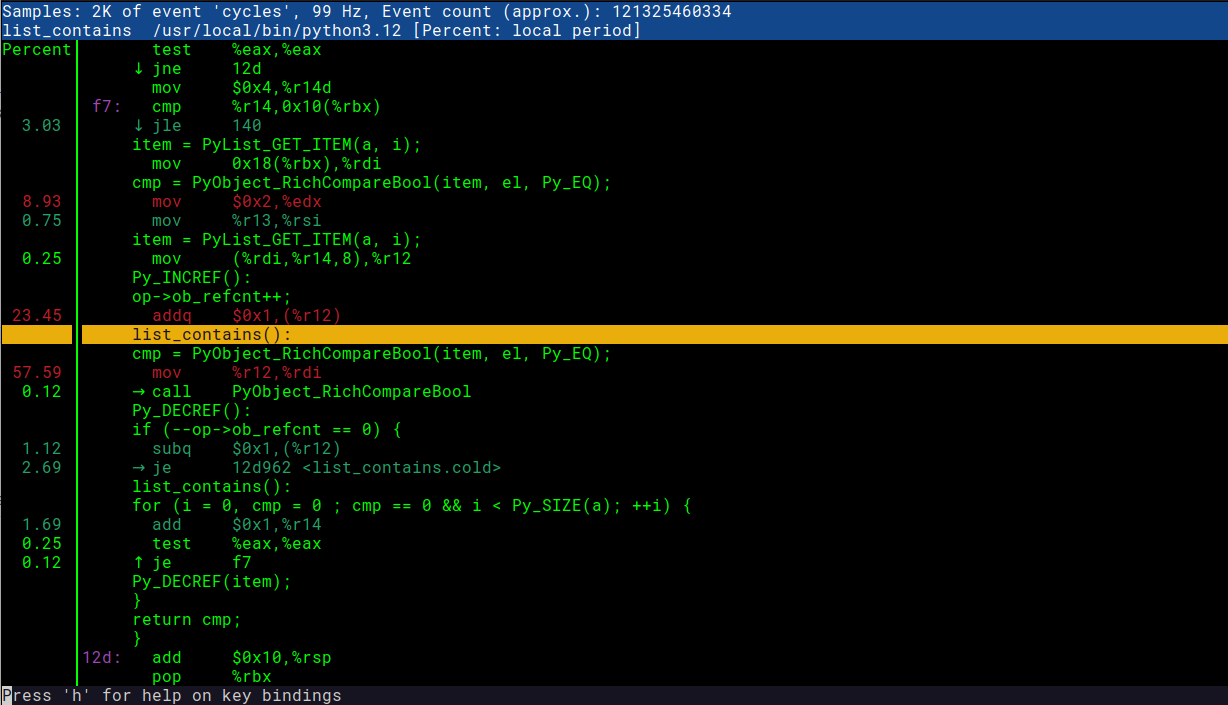
note: you may not always have access to the source code - in circumstances such as this you can view the disassembly in perf report directly to get some idea of what’s going on. I’ll add a quick section at the end showing how this looks
// I found this by going to https://github.com/python/cpython/ and searching for "list_contains"

static int
list_contains(PyListObject *a, PyObject *el)
{
    PyObject *item;
    Py_ssize_t i;
    int cmp;

    for (i = 0, cmp = 0 ; cmp == 0 && i < Py_SIZE(a); ++i) {
        item = PyList_GET_ITEM(a, i);
        Py_INCREF(item);
        cmp = PyObject_RichCompareBool(item, el, Py_EQ);
        Py_DECREF(item);
    }
    return cmp;
}
Nasty… looking at this code I can see that each time it is invoked it iterates over the array and performs a comparison against each item. That’s far from ideal for our usecase, so lets go back to the Python code we wrote. Our Flamegraph shows us that the problem is in our run_dummy method:
def run_dummy(numbers):
    for findme in range(100000):
        if findme in numbers:  #  <- this is what triggers list_contains
            print("found", findme)
        else:
            print("missed", findme)
We can’t really change that line as it is doing what we want it to do - identifying if an integer is in numbers. Perhaps we can change the numbers data type to one better suited to lookups. In our existing code we have:
    numbers = [i for i in range(20000000)]

    start_time = time.time()  # get the current time [start]
    run_dummy(numbers)  # run our inefficient method
Here we used a LIST data type for our “numbers”, which under the hood (in CPython) is implemented as dynamically-sized arrays and as such are nowhere near as efficient (O(N)) as the likes of a Hashtable for looking up an item (which is O(1)). A SET on the other hand (another Python data type) is implemented as a Hashtable and would give us the fast lookup we’re looking for. Lets change the data type in our Python code and see what the impact is:
    # we'll just change this line, casting numbers to a set before running run_dummy
    run_dummy(set(numbers))  # passing a set() for fast lookups
Now we can repeat the steps as above to generate our new flamegraph:
# record profile to "perf.data" file (default output)
perf record -F 99 -g -- python3.12 assets/dummy/perf_py_proj/after.py
...
found 99998
found 99999
Duration: 0.8350753784179688 seconds
[ perf record: Woken up 1 times to write data ]
[ perf record: Captured and wrote 0.039 MB perf.data (134 samples) ]
Already we can see that things have massively improved. Where previously this was taking 36 seconds to run it is now taking 0.8 seconds! Lets continue creating our flamegraph for the new improved code:
# read perf.data (created above) and display trace output
perf script > out.perf
# fold stack samples into single lines
# here I reference ~/FlameGraph/ - you can get this from https://github.com/brendangregg/FlameGraph
~/FlameGraph/stackcollapse-perf.pl out.perf > out.folded
# generate flamegraph
~/FlameGraph/flamegraph.pl out.folded > ./assets/perf_example_python3.12.after.svg
This is a much healthier looking Flamegraph and our application is now much faster as a result. The perf profiling support in Python 3.12 brings a tremendously useful tool to software engineers that want to deliver fast programs and I’m excited to see the impact this will have on the language.
bonus round: what to do when you can’t access the source code?⌗
Sometimes you don’t have access to the underlying code which can make trying to understand what’s going on much more difficult. Thankfully perf report allows us to view the dissassembled code which can help paint a picture of what the machine is actually doing. This is a reasonable first place to look - I tend to prefer the source code if I can get hold of it as it allows me to git blame / view the associated commits and PRs. To view this you can do the following:
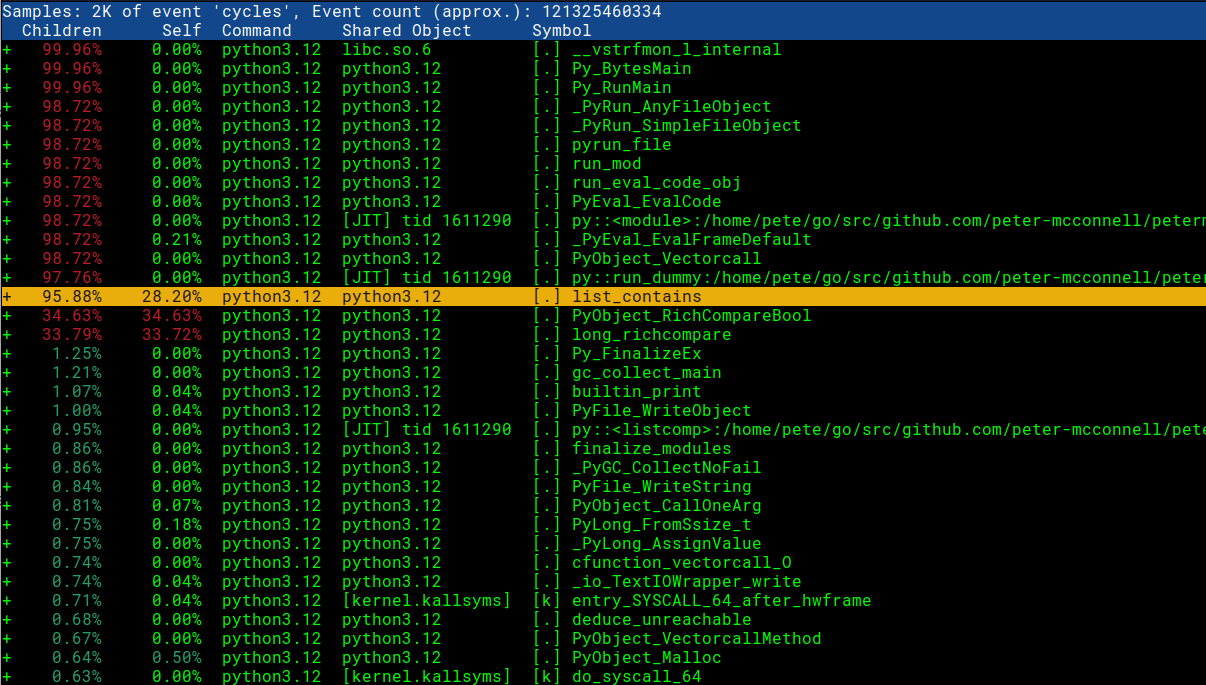
Open the perf report and select the line we’re interested in:
# this assumes we have already ran 'perf record' to generate perf.data ...
perf report -g -i perf.data

Press enter and choose the annotate option:

Behold! Here we can see both the C code and the machine instructions. Super useful! You can compare the screenshot below against the code snippet we’re interested in: https://github.com/python/cpython/blob/199507b81a302ea19f93593965b1e5088195a6c5/Objects/listobject.c#L440

recommended reading⌗
If this article has given you a taste for performance engineering, I can recommend the following Systems Performance book:
